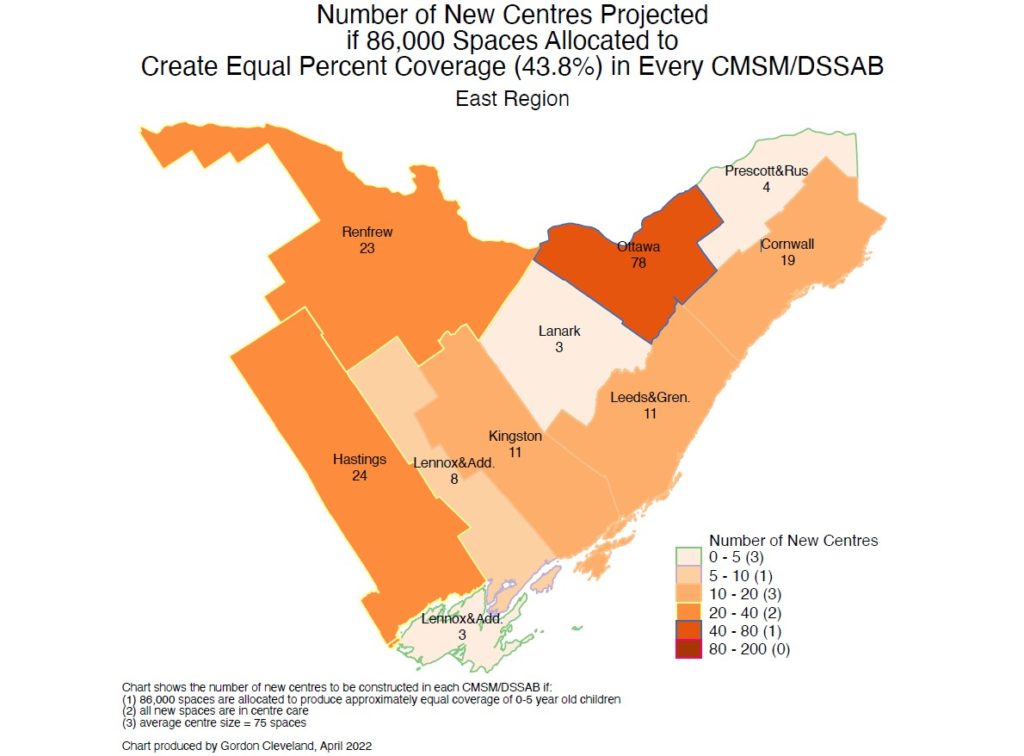
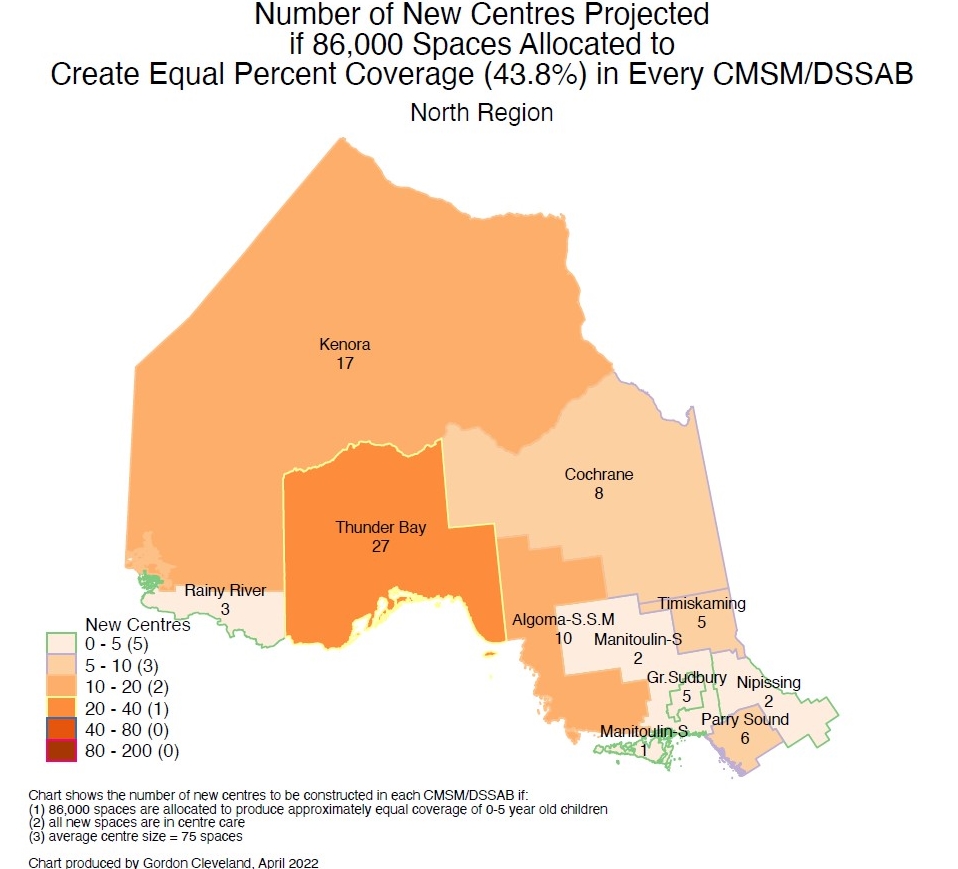
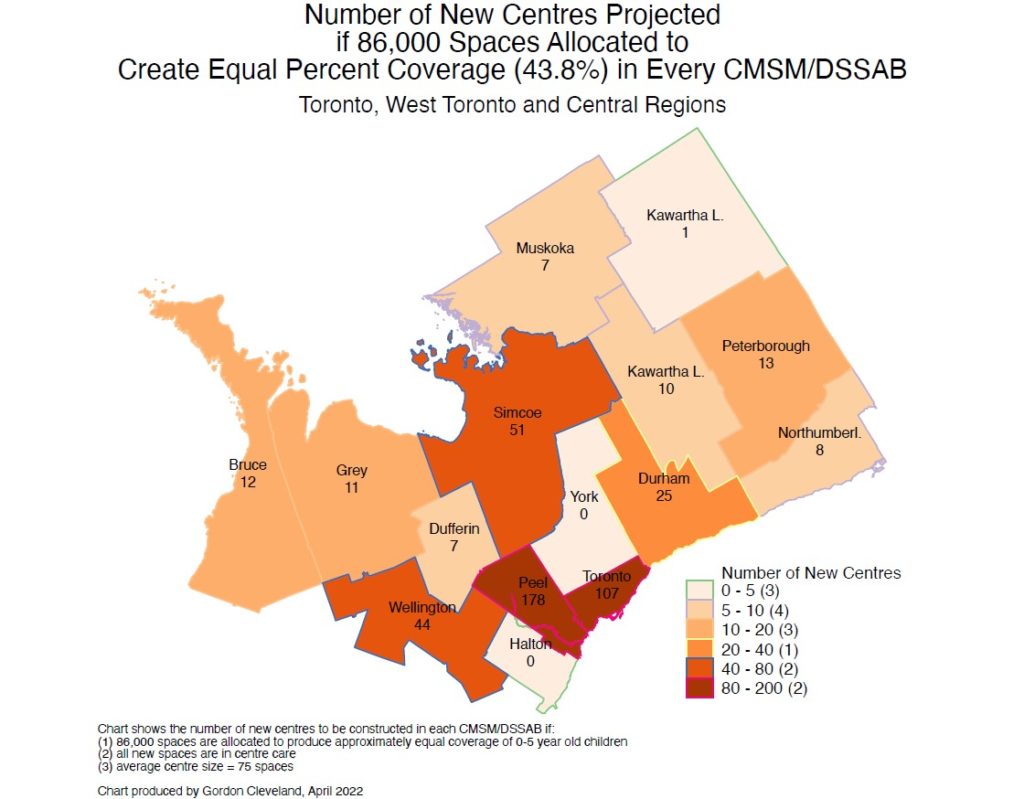
DR. Gordon Cleveland has prepared the attached charts for B2C2. These charts illustrate – as examples – the number of new centres required if there was equitable distribution across the province.
These maps show the number of new centres to be constructed in each Consolidated Municipal Service Manager or District Social Services Administration Board (CMSM/DSSAB). There is quite a variation across the province. These charts don’t attempt to show how many centres would be needed if other actors were considered, such as income, numbers of working mothers. We’ll see if Gordon can produce those next!
Also, the charts don’t take into account new home child care spaces even though we’re aware that there would be a substantial increase – adjustments for home child care can be added when we know what the province is planning.
Note that these regions shown are actually Census Divisions, which correspond very well (but not perfectly) to CMSM/DSSABs. For instance, Kawartha Lakes CMSM is shown twice because there are actually two Census Divisions that make up Kawartha Lakes CMSM. There are a couple of other anomalies. Prince Edward County is a separate Census Division, but in CMSM/DSSAB terms, it is part of Lennox and Addington. Another example: Sault-Ste. Marie is a separate CMSM, and the District of Algoma is a separate DSSAB. However, the Census Division of Algoma includes both of these.


